Fast Casual vs Quick Service: Financial Differences Operators Must Know
Fast casual and QSR both involve counter ordering, but their economics are substantially different. Here's the full P&L comparison every operator should understand.
Fast Casual vs Quick Service: Financial Differences Operators Must Know
Fast casual (Chipotle, Sweetgreen, Shake Shack) and quick service restaurants (QSR — McDonald's, Subway, Taco Bell) both involve counter ordering and fast delivery. But their economics are substantially different. Understanding the financial model of each concept is essential whether you're starting one, competing against one, or trying to figure out why your fast casual isn't hitting expected margins.
Defining the Models
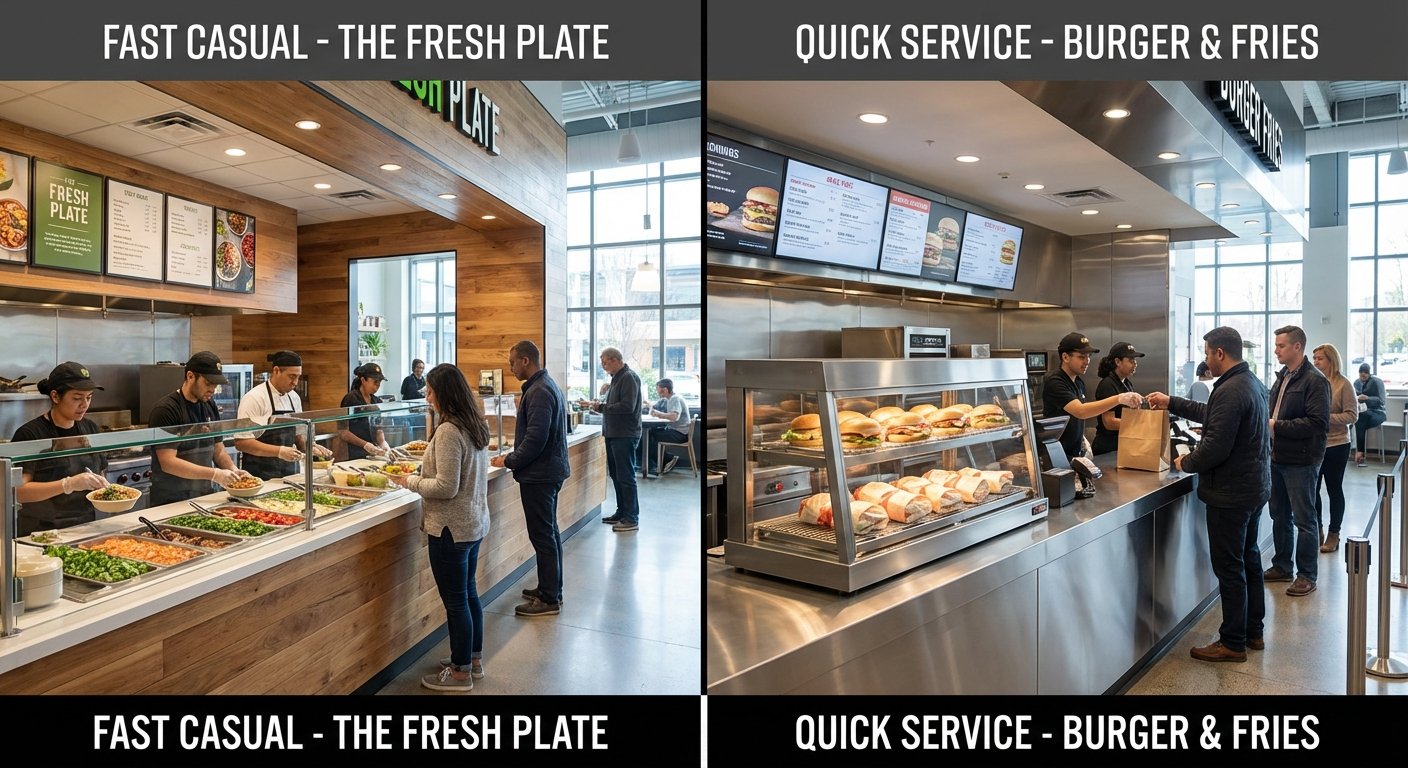
Quick Service Restaurant (QSR): Counter ordering, highly standardized menu, sub-$10 average check, fast production (under 3 minutes). Heavy drive-through emphasis. Menu items require minimal skill to execute. Labor is the largest variable cost.
Fast Casual: Counter ordering with higher perceived quality, $10–18 average check, visible preparation (open kitchens, assembly lines), some customization, no full table service. Higher ingredient quality than QSR. Higher check average, lower throughput.
P&L Comparison: Where the Numbers Land
| Line Item | QSR (franchised) | Fast Casual (independent) |
|---|---|---|
| Average check | $8–12 | $13–18 |
| Food cost | 26–32% | 28–35% |
| Labor cost | 26–32% | 28–34% |
| Prime cost | 54–62% | 56–68% |
| Rent/occupancy | 8–12% | 8–12% |
| Net margin | 8–15% | 6–12% |
QSR typically achieves slightly lower food cost through standardized recipes, centralized procurement, and limited menu complexity. But franchised QSR also carries royalty fees (4–8% of revenue) that independent fast casual doesn't.
Revenue Model: Volume vs. Check Average
QSR wins on transaction volume. A McDonald's doing 400 transactions per hour in drive-through is a revenue machine. A fast casual unit doing 60 transactions per hour during lunch peak is doing well by its standards.
Fast casual compensates with higher check averages. A Sweetgreen bowl at $16 vs. a McDonald's combo at $10 — fast casual runs 60% higher check on roughly 85% lower transaction volume.
QSR generally wins on absolute revenue per square foot in high-traffic locations. Fast casual wins on brand perception, loyalty, and the ability to charge premium prices in urban markets where drive-through isn't viable.
Labor Structure and Key Metrics
QSR labor is engineered for zero-skill execution. Any employee can learn the core menu in hours — enabling minimum wage staffing, high turnover tolerance, and low labor cost per transaction.
Fast casual labor requires more: assembly line skills, ingredient knowledge, customer-facing interaction. Labor cost as a percentage of revenue is similar to QSR but the mix differs — fewer total headcount, more capable staff, slightly higher wages.
The key metric for both: transactions per labor hour (TPLH).
- QSR target: 15–25 TPLH during peak
- Fast casual target: 8–15 TPLH
The higher revenue per transaction in fast casual offsets its lower volume.
Investment and Build-Out Costs
| QSR | Fast Casual | |
|---|---|---|
| Franchise fee | $30,000–50,000 | N/A (usually independent) |
| Total investment | $500K–2M+ | $350K–900K |
| Royalty/marketing fees | 8–12% of revenue | 0% (independent) |
| Break-even timeline | 3–5 years | 2–4 years |
Franchised QSR requires higher initial investment and ongoing royalties, but comes with a proven system and centralized marketing. Independent fast casual keeps all profit above break-even — but requires more operational creativity and execution.
Which Model Has Better Margins?
Neither, in isolation — execution and market matter more than the concept type. The best-run fast casual concepts hit 12–15% net margins. The best QSR franchisees hit 12–20%. Poorly run versions of either lose money.
The margin driver is the same for both: prime cost control. Whether you're selling $10 burritos or $15 grain bowls, if your food plus labor exceeds 65% of revenue, you won't survive rent, utilities, and other fixed costs.
What This Means for Independent Fast Casual Operators
If you're opening a fast casual concept, model your P&L against fast casual benchmarks — not full-service ones. Your revenue model is high transaction volume, no alcohol, fast turns. Your labor model is counter service with no tip pool. Your food cost targets are different from a white-tablecloth restaurant.
Benchmark against the right peer group. Don't optimize for a dining experience you're not providing.
FAQ: Fast Casual vs QSR
Is fast casual or QSR more profitable?
Neither is categorically more profitable — both can achieve 10–15% net margins when well-executed. QSR benefits from volume and franchise systems; fast casual benefits from higher check averages and lower franchise overhead.
What is a typical fast casual food cost percentage?
Fast casual food cost typically runs 28–35%, compared to 26–32% for QSR. The higher cost reflects better ingredient quality and more customization.
What's the biggest financial mistake fast casual operators make?
Benchmarking against the wrong concept type. Fast casual operators who target full-service margins (aiming for 30%+ net) understaff and underinvest, then wonder why operations suffer. The correct prime cost target for fast casual is 56–68%.
Ready to take control of your food costs? Try CostLab free for 14 days →
Track Food Cost on Every Dish — Automatically
CostLab.AI calculates food cost percentage in real time. Update one ingredient price and see the impact across your entire menu instantly.
Start Free Trial →