Restaurant Theft & Shrinkage Prevention: Stop Inventory Loss
75% of restaurant inventory loss involves employee theft. Learn to detect shrinkage using the theoretical vs. actual framework and build systems to stop it.
Restaurant Theft & Shrinkage Prevention: Stop Inventory Loss
Restaurant theft and shrinkage aren't rare problems—industry research consistently estimates that 75% of all restaurant inventory loss involves employee theft in some form. Not always dramatic, but systematic small losses that add up. A 3–4% gap between your theoretical food cost (what food should cost based on sales) and actual food cost often means something is being taken, wasted without accountability, or stolen.
Here's how to identify where your loss is coming from and build the systems to stop it.
The Theoretical vs. Actual Framework
Every restaurant has two food cost numbers:
Theoretical food cost: What your food should cost based on what was sold. If you sold 50 chicken sandwiches, each requiring 6 oz of chicken at $0.87/oz, you should have used $43.50 in chicken. Calculate this across all menu items sold.
Actual food cost: What you actually used, based on purchases plus or minus inventory change.
The gap between them—your variance—is shrinkage. In a well-run restaurant, variance is 0–1.5%. At 3–5%, something is wrong. At 5%+, you have a serious problem.
Variance doesn't automatically mean theft—it also captures waste, spillage, recipe inconsistency, and measurement error. But persistent high variance concentrated in specific categories often points to a specific source.
Where Restaurant Theft Actually Happens
Kitchen inventory theft. Proteins are the most commonly stolen kitchen item—steak, seafood, deli meats. Small quantities taken home at shift end are rarely caught without inventory controls. A cook taking one salmon fillet per shift costs $3–6/day, or $800–1,600/year.
Front-of-house cash theft. Walk-outs (voiding a paid check after pocketing cash) and false refunds are the most common FOH theft vectors. This is a POS control issue.
Bar theft. Bartenders have more theft opportunities than any other role—selling drinks without ringing them, over-pouring, using house liquor and pocketing proceeds, giving free drinks in exchange for large cash tips.
Supplier theft. Short counts on deliveries (fewer units than invoiced), quality substitutions, driver-level theft. Less common but worth counting deliveries before signing invoices.
Detection Systems That Work
Weekly inventory counts. Monthly counts mean you find problems 30 days after they started. Weekly counts on high-value items (proteins, seafood, premium produce, spirits) let you catch variance within a week.
Item-level theoretical tracking. For your top 10 highest-cost ingredients, calculate expected usage weekly: items sold × recipe quantity = expected depletion. Compare to actual. If salmon theoretical is 12 lb but you're depleting 15 lb/week, something is wrong.
Blind counts. Periodically count inventory without telling your team, or have a manager count independently from whoever normally handles it. Compare results.
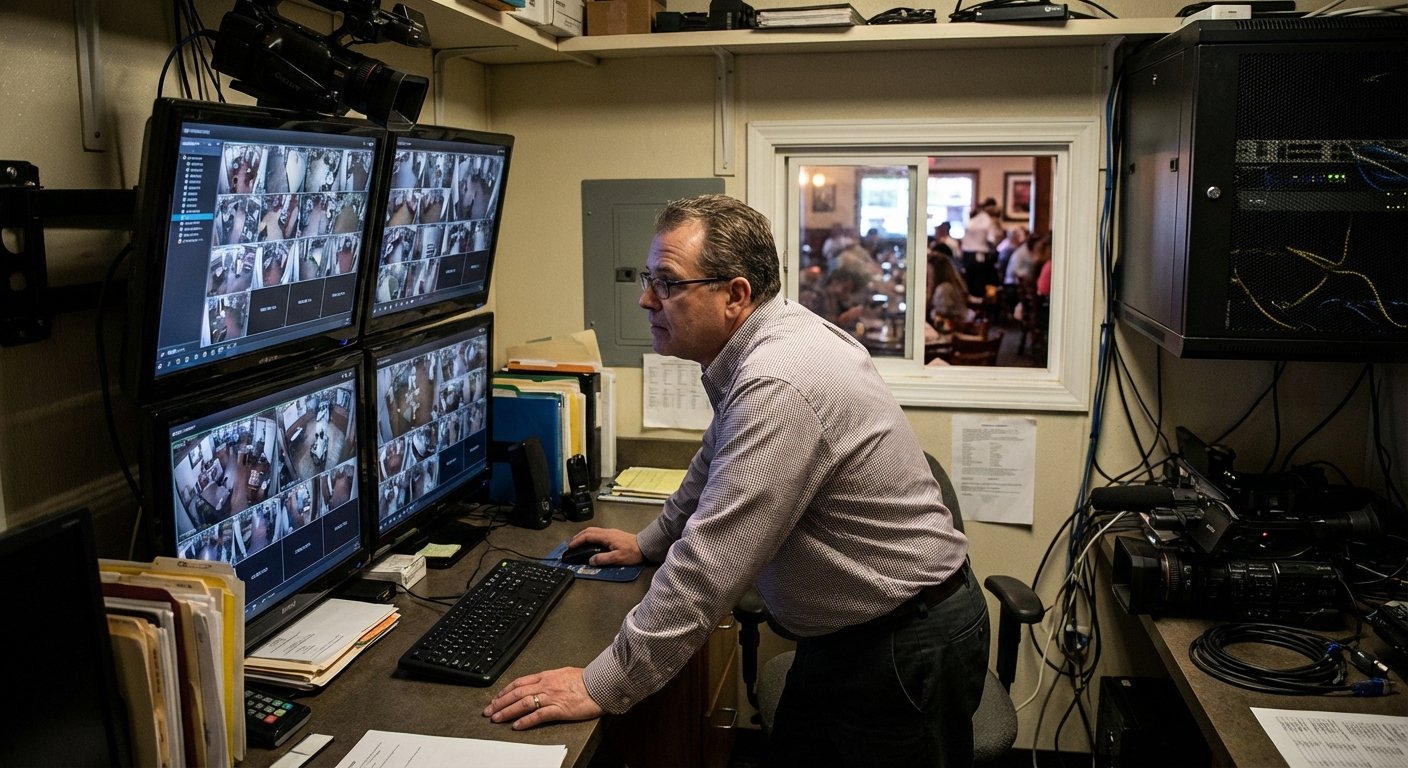
Camera placement. Cameras in the walk-in cooler, at the back door, and behind the bar are the highest-impact locations. Their presence reduces theft even when no one is actively monitoring.
POS controls. Voids and comps should require manager approval. Discounts should require a code. Refunds should trigger a receipt and camera review process. These don't eliminate theft but eliminate easy opportunities.
Waste vs. Theft: How to Tell the Difference
When you find a gap, the first question is: waste or theft? They require different responses.
Waste indicators:
- Gap is spread across many items rather than concentrated in one
- Kitchen staff changes correlate with gap changes
- Items nearing expiry are frequently discarded
- Overproduction is common
Theft indicators:
- Gap concentrates in specific high-value, portable items
- Gap appears consistently regardless of season or menu
- Gap increases on specific shifts or with specific staff patterns
- POS shows unusual void or comp patterns
Waste requires systems and training. Theft requires investigation and potentially termination.
Building a Prevention System
Layer your controls for maximum effectiveness:
- Weekly inventory counts on your top 20 items by cost
- Theoretical vs. actual tracking for all menu items
- Manager-only approvals for all voids, comps, and discounts over $5
- Cameras in walk-in coolers, back doors, and behind every bar
- Blind audits quarterly or whenever variance spikes
Frequently Asked Questions
What's an acceptable food cost variance?
0–1.5% is well-controlled. 2–3% is typical for independent restaurants. Above 3% warrants investigation; above 5% is a serious problem requiring immediate action.
Should I tell my team I'm implementing inventory tracking?
Yes. Transparency is actually a deterrent—when staff know variance is tracked weekly, opportunistic theft decreases significantly. Save your covert surveillance for specific investigation.
How do I approach a theft conversation with an employee?
Involve your HR advisor or employment attorney before confronting anyone. Present facts (inventory variance data, POS records) rather than accusations, and document everything.
Ready to take control of your food costs? Try CostLab free for 14 days →
Track Food Cost on Every Dish — Automatically
CostLab.AI calculates food cost percentage in real time. Update one ingredient price and see the impact across your entire menu instantly.
Start Free Trial →