Franchise Food Cost Systems: What Independent Restaurants Can Learn
McDonald's runs 30% food cost across 40,000 locations. The systems they use aren't secret—and independent restaurants can implement them too. Here's how.
Franchise Food Cost Systems: What Independent Restaurants Can Learn
Franchise food cost systems are why McDonald's runs approximately 30% food cost across 40,000 restaurants in 100 countries, and why Chipotle holds 30–31% across 3,500 locations. These chains don't have better ingredients than you—they have better systems.
The systems they use to achieve consistent food cost control are not secret. Most can be implemented by a single-unit independent operator with a spreadsheet and discipline.
System 1: Standardized Recipes with Exact Weights
McDonald's doesn't teach employees to make a burger. They teach them to execute a spec sheet. Every ingredient has a weight. A Quarter Pounder patty is 4.0 oz raw, every time. Fries are measured with a standardized scoop, not eyeballed.
What this means for you: Every menu item needs a recipe card with exact weights for every ingredient. Not "a handful of arugula"—1.5 oz of arugula. Weigh it. Train to it. Check it.
The food cost impact of eyeballing vs. weighing is typically 3–6% of food cost. If your arugula portions drift from 1.5 oz to 2.0 oz per plate, your food cost on that item increases by 33%. At 150 covers/day, that's thousands of dollars annually.
System 2: Theoretical vs. Actual Variance Tracking
Every major chain tracks two food cost numbers:
- Theoretical: What food cost should be based on sales mix x standard recipe costs
- Actual: What you actually bought and used
The gap—variance—is your shrinkage. At Chipotle, store managers are expected to keep variance under 1%. At independent restaurants, the average variance is 5–8%—meaning theft, waste, or recipe drift is costing you several points of food cost.
What this means for you: Calculate theoretical food cost using your POS sales data. Take every item sold this week, multiply by the standard recipe cost, sum them up. Compare to actual purchases + inventory change. The gap tells you exactly what's leaking.
System 3: Daily Waste Tracking
Chains track every food item thrown away. At shift end, a manager records waste: 2 burger patties discarded, 1 portion of fries cooked but not served, 1 bun rejected for quality.
Acceptable waste is 1–2% of food cost. Above 3% triggers investigation—is this overproduction, a supplier quality issue, or theft disguised as waste?
What this means for you: A simple waste log on the line—paper or digital. Any discarded item gets recorded with the reason. Review weekly. Your biggest waste items are your biggest cost reduction opportunities.
System 4: Par Levels and Pull Sheets
Chains don't order based on intuition. They use par levels—minimum and maximum quantities for every ingredient based on projected sales. If par for ground beef is 40 lb/day and you have 65 lb in the walk-in, you don't order beef today.
The ordering process is driven by a pull sheet: a daily checklist that compares current inventory to par, calculates the order quantity, and generates a purchase order.
What this means for you: Set par levels for your 20 most-used ingredients based on typical weekly usage. Check them daily before ordering. This eliminates over-ordering perishables that expire before use.
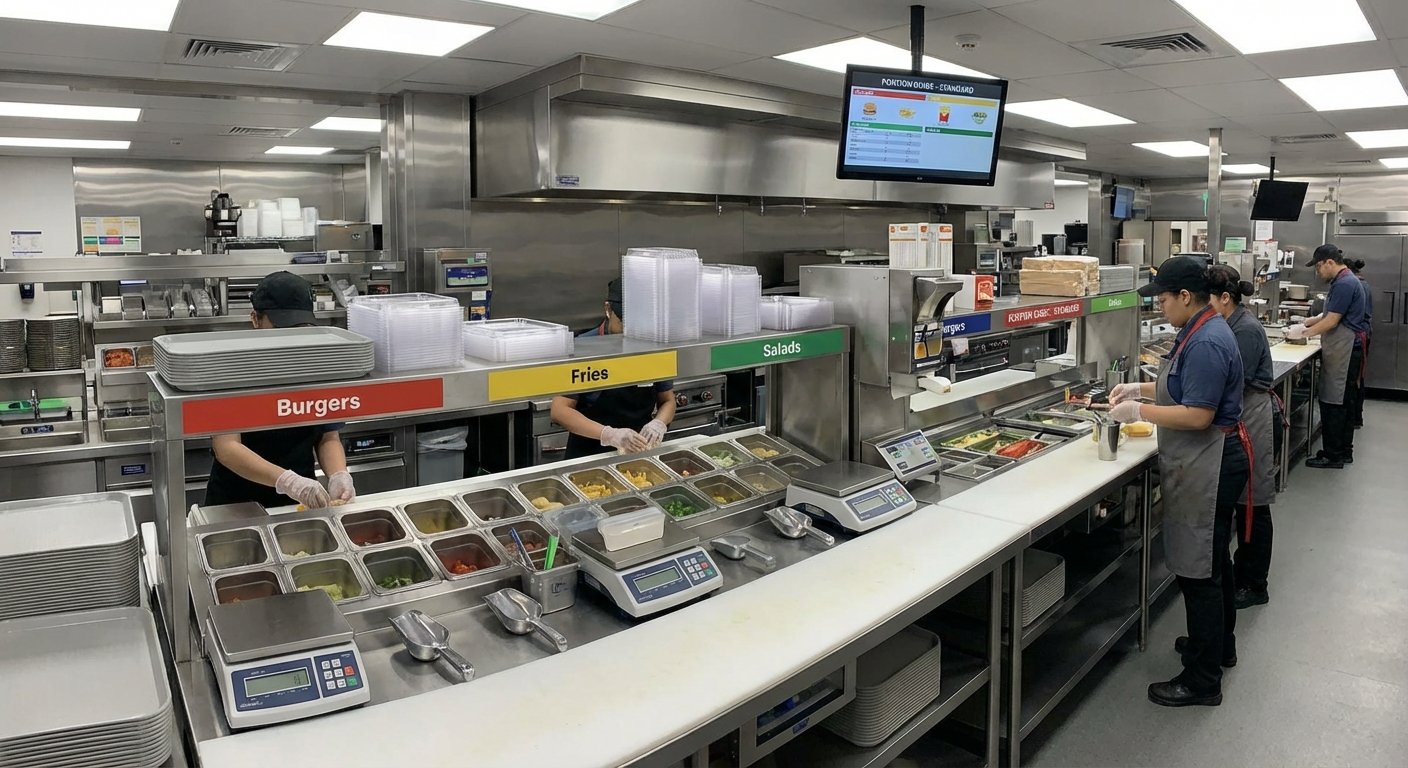
System 5: Portion Control Equipment
Scales. Portioning scoops. Ladles with specific volumes. These are not luxury items—they're food cost tools.
A single ladle upgrade (switching from a 4 oz to a 3 oz ladle for pasta sauce) can be worth $800–1,200/year if you're serving 150 portions/day.
The investment: $200–500 in standardized portioning tools pays back in weeks, not years.
System 6: Menu Simplicity
McDonald's original menu was 9 items. Even today, their core menu is far simpler than most independent restaurants. Fewer items mean:
- Fewer ingredients (less purchasing complexity, better volume per SKU)
- Lower prep labor and training burden
- Less waste from slow-moving items
The average independent restaurant has 40–80 menu items. The average chain has 20–35. Every item you cut eliminates prep time, purchasing complexity, and a potential waste source.
The audit: Look at your bottom 20% of menu items by sales velocity. If they're not meaningful contributors to margin or brand identity, cut them.
Frequently Asked Questions
How do I calculate theoretical food cost without expensive software?
Export your POS sales data to a spreadsheet. For each item sold, multiply units x recipe cost. Sum all items to get theoretical food cost. Compare to actual purchases +/- inventory change. This can be done in Excel with a recipe cost database.
What's the most impactful system to implement first?
Standardized recipe weights with actual portion scales. This single change typically reduces food cost by 2–4 points and provides the baseline data needed for every other system.
How often should I count inventory for variance tracking?
Weekly counts are the minimum for meaningful variance tracking. High-value items (proteins, premium spirits) should be counted more frequently—some operators do daily spot counts on their top 5 items.
Ready to take control of your food costs? Try CostLab free for 14 days →
Track Food Cost on Every Dish — Automatically
CostLab.AI calculates food cost percentage in real time. Update one ingredient price and see the impact across your entire menu instantly.
Start Free Trial →